
Tennessee Football 2022 Stat Review: Running Backs
2022 Stat Review: (Part 1: Offensive Line)
The quest for advanced stats continues, though it might cost me my sanity. I've spent the last two weeks teaching myself a programming language called R so that I can make pretty graphs like the ones down the page. I'm through the looking glass and down the rabbit hole. I've seen the Mad Hatter and I don't mean Les Miles-though come to think of it, he was probably there too. Anyway, it's no use going back to yesterday, because I was a different person then. So, this post is going to focus on usage and expected points added--if you already know those concepts, just scroll down to the pretty charts. Otherwise, let me teach you about these stats that I've only recently learned about myself.
Let's talk about Usage and Expected Points. Usage is simply the percentage of plays on which a player was a rusher, passer, receiver, or intended receiver (targeted). Usage can then be broken down lots of ways--by down, by play type, by looking at just successful plays, filtering out garbage time, etc. It gives you a great look at how much a player is being depended on and in what situation.
Expected Points (EP) gets a little trickier, but it's really just a numerical value placed on a concept you understand inherently to begin with: field position matters. It always has--that's why back in the day General Neyland would often choose to kick off after giving up a touchdown (yes, the rules allowed that then), because the field position was more valuable than the ball. Of course it would be coaching malfeasance to do such in today's game, but I can easily think of two games where the importance of field position obviously came into play: the Hobnail Boot game and the Dobbnail Boot game. In both instances, the trailing team was able to take a last-second lead in large part because they were gifted great field position.
EP assigns a value to each yard line to measure the points that are expected to be scored from that down, distance, and field position. Consider: there are thousands (millions?) of drives that have started 1st & 10 from the 25, how many points did each drive end with? Some end in 7, some 6, many 3, most 0, and a few even -2. When all of those results are averaged together, you have an EP value for 1st-and-10 at the 25 (it's generally around 0.6 points, by the way). You can do the same for any down & distance on the field. So when Tennessee chose to squib kick to UGA in 2001, or when UGA took an unsportsmanlike penalty after scoring late in 2016, the expected points for the receiving team more than doubled in each situation. A kick out the back of the endzone for a touchback would have started each offense with a fraction of the EP that they ended up with in real life.
There are many different ways of measuring EP, some take things like time remaining into account, for example. In fact, one formula uses up to 96(?!) variables in figuring expected points value. We are going to use collegefootballdata.com's implementation (called Predicted Points, or PP) because they make their data easily accessible. And we are going to use it by looking at individual players' PPA--Predicted Points Added--a measure of how many Predicted Points a player adds on a particular play (for example, if it's 1st&10 at the 25, a PP of 0.6, and Jabari Small rushed for seven yards, it's now 2nd&3 at the 32, a PP of 1.5: Small had a PPA of 0.9 on the play).
Let's get to the numbers:
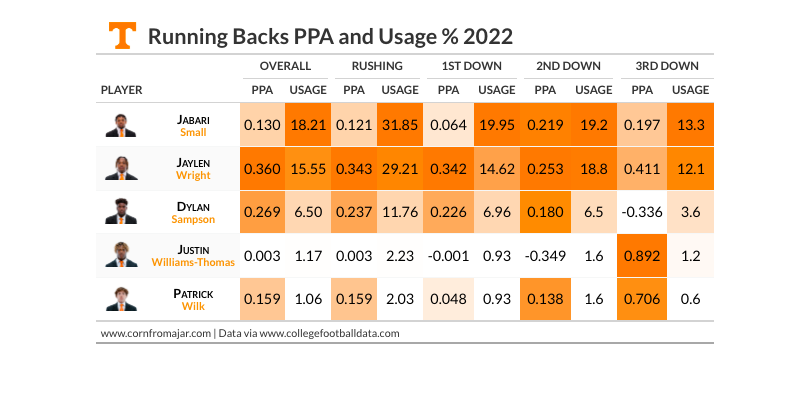
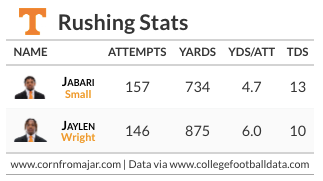
What conclusions can we draw from this? I'd first want to consider the idea that Jaylen Wright might be our best running back. He gets less usage than Jabari Small but adds more Predicted Points on average, and sometimes a lot more. Looking at traditional stats, Wright also had more total yards and more yards per carry despite getting fewer carries, and more yards per game :

- (I seem to have left LSU out of my dataset. My bad.)
- I hope TAMU took out rental insurance on Devon Achane, because they are beating the hell out of that kid.
- Quinshon Judkins is the real deal, probably the best PPA-to-Usage in the SEC, as opposed to
- Tank Bigsby, kinda yikes dude--lots of usage, little PPA (maybe don't give him the ball on 2nd down).
- There's a grouping of backs around the 13-15 range that have a lot in common: they're the #2 back on their team and get significantly less usage, but provide significantly more PPA (Zach Evans, Jarquez Hunter, and Jaylen Wright, in case you missed it). In fact, if you sorted this chart by overall PPA, those dudes are at the top of the conference. In fact...

Overall Tennessee got a lot out of its running backs in 2022 considering a relative lack of star power at the position. The Vols had two solid options in the backfield who were/are largely interchangeable. Both backs added a ton of value to the offense relative to their usage. On top of that there's Dylan Sampson who showed flashes of brilliance in 2022, and a crop of recruits in the 2023 class that upgrade the position from a recruiting-ranking standpoint (but we'll get to that another day). Tennessee needs the position to be good too, considering the Vols run more than they pass--although I'll dispel that myth to some degree when reviewing wide receivers. In theory, UT's already impressive backfield should be even better in 2023, which would take some heat off of Joe Milton as Tennessee's new quarterback.

Comments