
Tennessee Football 2022 Stat Review: Offensive Line
I was an English major. I’ll admit I’m not the most qualified person to bring you detailed analysis of numbers. But I am qualified to explain to you the meaning of a story in as many different ways as I can find, and what are sports but a story unfolding live in front of us? Fans gather with their beer and Petro's for the spectacle and suspense just like feasting Saxon warriors gathered before ancient scops to hear a tale of heroic deeds. And stats are just one type of figurative language that helps carry the underlying meaning of the story told. 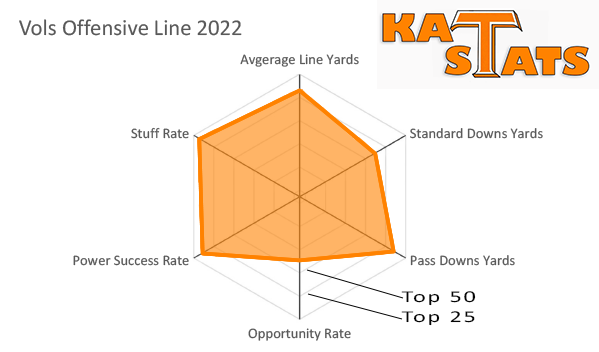
So I figure if a guy with a literature degree is going to talk numbers to you, we might as well make it weird from the jump and start in the least likely of places: offensive line statistics. Football Outsiders tracks a few different run-blocking categories, defined below:
- Line Yards per Carry: the line gets credit for rushing yardage between 0-3 yards... and 50% credit for yards 4-8.... Anything over 8 yards is quantified as a highlight opportunity, and credit goes to the runner. As with the pro definition, lost yardage still counts for 125%. (Garbage time is filtered out for all line yardage averages.)
- Standard Downs Line Yards per Carry: The raw, unadjusted per-carry line yardage for a team on standard downs (first down, second-and-7 or fewer, third-and-4 or fewer, fourth-and-4 or fewer).
- Passing Downs Line Yards per Carry: The same unadjusted averages for rushing on passing downs.
- Opportunity Rate: The percentage of carries (when four yards are available) that gain at least four yards, i.e. the percentage of carries in which the line does its job, so to speak.
- Power Success Rate: [P]ercentage of runs on third or fourth down, two yards or less to go, that achieved a first down or touchdown.
- Stuff Rate: [P]ercentage of carries by running backs that are stopped at or before the line of scrimmage.
I've visualized Tennessee's 2022 national rank in each of these categories in this chart. Each band of the chart is an increment of 25--the closer to the outside band, the higher the rank in each category. (Or, the more of the hexagon filled in, the better you are.)

Here's why I love the story told by statistics: going off my memory and the eye test, I would have told you that a significant number of Tennessee run plays went nowhere. The Vols were middle of the pack in the SEC in rushing yards per game and yards per carry after all. According to these numbers, though, UT excelled at not getting stuffed at the line and at converting in short-yardage plays. UT was top-25 in most categories and top-50 in all categories--except "Opportunity Rate", and we'll come back to that in a minute.
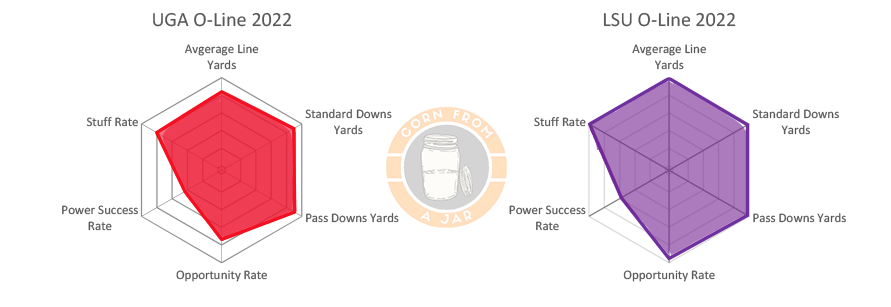
For comparison I thought it would be interesting to see how some other teams stack up against Tennessee's numbers. So for starters, here's the same chart for LSU (the national leader in many of these categories) and UGA.

Not surprised that Georgia was very good in most of these categories. A little surprising that LSU is the best in nearly all of them. Recruiting stars aren't everything, but using the On3 industry ranking, UGA's o-line starters average a 4.2 star rating and 95.1 ranking, LSU is a 3.8 and 90.48 on average. Tennessee's numbers are more in line with LSU at 3.8 and 90.3.
Interesting to me, UGA and LSU have the same weakness according to these stats, "Power Success Rate" (i.e., not converting on 3rd or 4th and 2 or less). Tennessee meanwhile was outstanding in this regard, but poor in "Opportunity Rate" (i.e., the percentage of time a run gains 4 yards).
The FO definition of Opportunity Rate includes "the percentage of carries in which the line does its job, so to speak." So if these numbers have validity, it's a little concerning that Tennessee struggled in that category specifically. It might also explain why in my memory it seemed like Tennessee's run plays often looked like this:
There's a descent push and it's a positive play, so check off stuff rate, line yards, and standard down yards; but only three yards gained--so put a big fat X by opportunity rate.
By being 11th nationally in power success rate, Tennessee was among the nation's best in getting two yards when it matters most. But by being 64th in opportunity rate, the Vols were only middling at getting four yards a pop consistently.
Since Tennessee averaged 199.46 rushing yards per game and 4.96 yards per carry in 2022 and also had the top offense nationally, does a milquetoast opportunity rate really matter? To answer that, I'm going to give you one more deep-cut stat: success rate. Each play is deemed successful or not based on the percentage of yards to go gained. A play is deemed “successful” when:
- At least 50% of the yards-to-go are earned on 1st down (i.e. 5 yds. on 1st-and-10)
- At least 70% of the yards-to-go are earned on 2nd down (i.e. 7 yds. on 2nd-and-10, or 5 yds. on 2nd-and-6)
- 100% of the yards-to-go are earned on 3rd and 4th down (i.e. you get a first down)
- A Touchdown would also be considered a successful play, no matter the yards-to-go
According to the chart in this post by Bill Connelly, success rate unsurprisingly goes up as down-and-distance diminishes. So while there's not a huge difference in success rate on 2nd-and-7 or 2nd-and-6, there is a marked difference in success rate on 3rd-and-2 vs. 3rd-and-4. Simply put, getting 4+ yards more consistently will set you up for a better success rate later on.
For Tennessee specifically, getting to 3rd-and-2 is significant because of their outstanding power success rate (converting on those short-yardage plays). The more often you can reliably get yourself 4 or more yards per rush, the more you can get into those short yardage situations with a higher chance to convert.
Or at least that was true in 2022. Will these stats, especially that short-yardage stat, hold steady in 2023? It will be difficult to maintain without top-10 NFL draft pick Darnell Wright anchoring the line. Short-yardage runs were a focus of the offseason last year, and they obviously improved. Can they keep that growth while also improving opportunity rate and plugging some holes on the line as well? We'll try to answer those questions at another time, but it will be a tall task for OL coach Greg Elarbee and his staff.
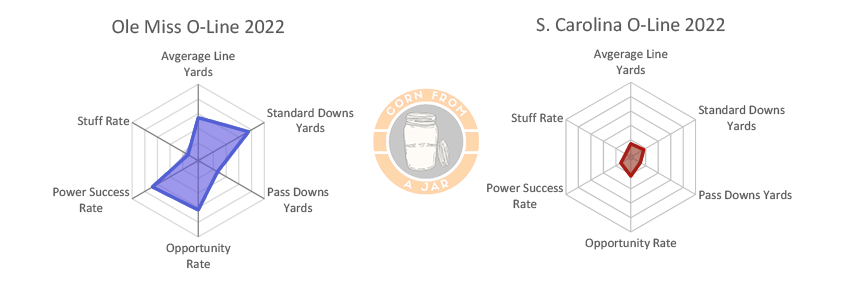
One final point of comparison: how last year's statistical rushing leader for the SEC (and nationally not counting service academies) and Tennessee's other loss from 2022 stack up in these statistical categories:

Do with that info as you will.

Comments