It's Baseball Time in Tennessee: #11 Vols vs. #3 Florida Series Preview (April 6-8)
Recently: Frustration and hope comingled in Baton Rouge last weekend. For example, a two-out double in the bottom of the 8th inning pushed three unearned runs across the plate for LSU in a 5-2 win over the Vols on Thursday. In fact, 8 of the 18 runs LSU scored against Tennessee on the weekend were unearned. However, the Vols were competitive in both losses and pretty dominant in Saturday's 14-7 win, probably as good an outcome as could realistically be desired against the #1 team in America.
Meanwhile Florida took two of three against Auburn in Gainesville in a series where none of the games were particularly close. The Gators also won a game 8-4 against Bethune-Cookman on Tuesday. (The stats in this preview were compiled before the Gators' midweek game)
Tennessee had no midweek game this week.
Previously on Vols-Gators: Tennessee is just 94-154 all-time against Florida, but the Vols have won five straight and nine of the last ten, including beating UF for the SEC Tournament championship in Hoover last May. UT also swept Florida in their 2022 regular-season series in Gainesville.
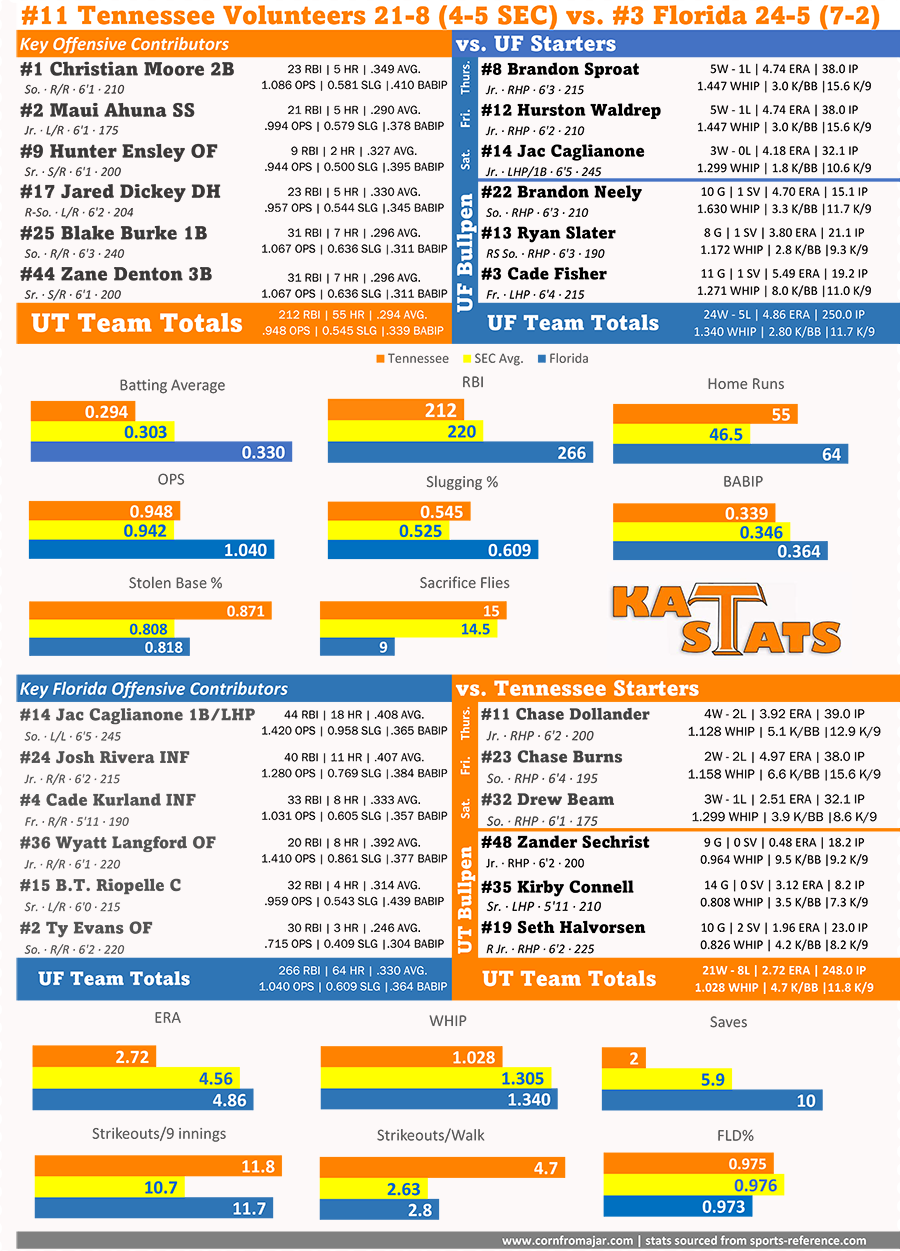
What to Watch For: Florida's Jac Caglianone is the kind of guy you absolutely love when he plays for you, and completely despise when he plays for your rival. Caglianone plays first base for the Gators and leads the team in hits, home runs, batting average, and OPS. Oh, and he pitches for UF too, well enough to be a weekend starter. His ERA isn't stellar, but he has a WHIP equal to UT's Drew Beam, and he strikes out 10.6 batters per nine innings. Plus he pronounces his name "Jack" despite it being spelled like he would be tag-teaming with Dino Bravo as one of The Quebecers. Vol fans, this will be the guy you can't stand by the end of the weekend.
Overall statistically, there's a lot of similarities between this series and the LSU series. Tennessee lags behind Florida (and the SEC average, unfortunately) in most offensive categories. However, UT's pitching staff is far superior. Let's go to the KAT STATS(TM):
Why These Stats? Baseball is THE numbers game, giving fans and analysts a wealth of digits to work with. It's a blessing and a curse, as a quest for deeper analytics can quickly become paralysis by analysis. There's the traditional stats like RBI and ERA. Then there's more advanced stuff like wOBA and xFIP. How do you know what to pay attention to?
Well, part of the problem is solved by the fact that college baseball stats are hard to find and/or paywalled. Sports-reference.com has a good database of college stats, but it's buried deep in their baseball section and not nearly as robust as their basketball stats, for example. D1baseball.com has stats for all teams, but costs $150/year. So I'm using stats I have free access to for now.
I wanted a balance between traditional stats and some advanced analytics. For batters, I chose to use the holy trinity of stats for the last century or so: runs batted in, batting average, and home runs. On-base percentage and slugging percentage have gained popularity over the last couple of decades, as has their sum, on-base plus slugging (OPS). For the sake of space, I've decided to just list slugging and OPS, subtract the former from the latter if you want to know the OB%.
Then I found an advanced stat I thought was pretty cool while also not being hard to calculate from scratch (removing the need for paywalled stats). It's batting average on balls in play (BABIP). Just as it says on the tin, the idea is to only count hits on balls put into play--so take out home runs and strikeouts and add back in sacrifice flies. The formula is (H – HR)/(AB – K – HR + SF). This stat is cool because once the ball is put in play, either skill or luck is going to determine the outcome. If a batter has a particularly high BABIP, he's either facing poor defenses, is exceptional at placing the ball, or very lucky. The opposite is true for a low BABIP. The stat doesn't tell you which of those factors is happening, but it gives you something to watch for.
Similarly for pitching, I went with the traditional stats of W/L (or saves for relivers) and ERA, then WHIP (walks+hits/inning) for an idea of how many runners the pitcher generally allows, strikeouts per walk, and strikeouts per 9 innings. That might be too much focus on strikeouts, but I grew up on Nolan Ryan, rare steak, and a 1969 Dodge Charger, dammit. Strikeouts remain king around here.


Comments